It’s a common misconception that zero energy homes are all added cost, available only to those with cash to spare. Nothing could be further from the truth. The fact is, everybody profits from zero energy homes. In Part One of this two-part series, we show how all homeowners profit financially from zero energy homes no matter how you calculate the financial return. In Part Two, Everybody Wins with Zero Energy Homes!, we will show how, in addition to paying off financially for homebuyers, zero energy homes pay off in health, comfort, and quiet for the home’s residents. All other stakeholders – from lenders to builders, realtors to utilities – stand to win with zero homes as well. In other words: Zero energy homes are a win for everybody!
Zero Energy Homes Do Cost More to Build – But Not Much More
Because zero energy homes do cost a little more to build, it is easy to think that they are financial losers, but no matter how you calculate financial return – pay back in years, return on investment, internal rate of return or cost of ownership – zero energy homes are almost always a better deal than a similar home built to code. The most effective of these calculations may be cost of ownership because when comparing the savings on cost of ownership, homebuyers can see their savings start the very first month, and what looks like an expense is, in reality, a profitable investment.
Based on a recent Rocky Mountain Institute (RMI) nationwide study, a standard zero energy home* costs, on average, 7.3% more to build. A zero energy READY home cost about 1.8% more to build than a similar home built to code. Our experience building zero energy homes in Bend, Oregon confirms a 7 to 8% incremental cost for zero homes. So, yes, zero energy homes cost a bit more to build. But unlike most other home expenses, this one comes with positive financial returns. So, what are the returns on this added cost? There are four ways of calculating earnings on the incremental cost it takes to get to zero: payback in years, return on investment, internal rate of return, and cost of ownership. Using any or all of these approaches, well designed and cost-effectively built zero energy homes are a financial win.
Payback Period
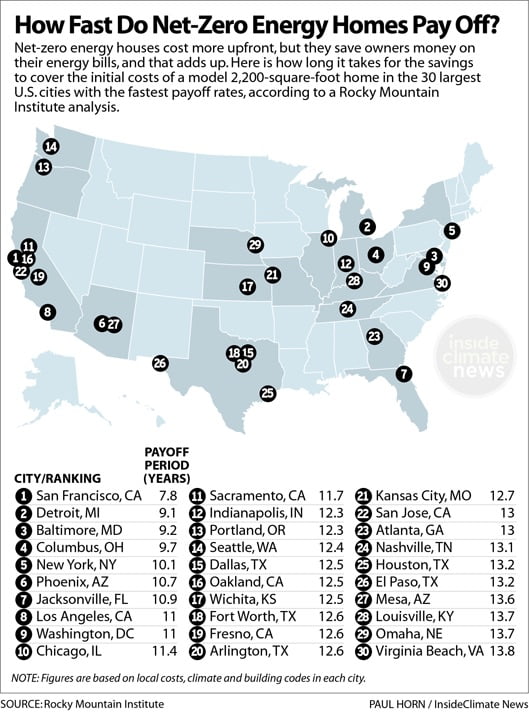
Payback period is most commonly used to describe the financial consequences of investing in tangible assets by describing how long it takes for the stream of income to equal the initial cost. It’s the length of time it takes to “break even” or get the entire investment back. Once the break even point is reached, energy savings for a zero energy home would be all profit. It’s commonly applied to energy efficiency measures, but it is also the least useful calculation since it creates the erroneous impression that homebuyers will not benefit for many years. Nonetheless, based on the RMI study, zero energy homes have a payback period ranging from 7.8 to 13.8 years, with an average pay back of about 12 years. Zero energy ready homes have an approximate payback period of anywhere from 3 to 8 years. But payback period does not tell the whole story. Like interest on a bank account, energy improvements return cash value every month. Builders, realtors, and homebuyers should look beyond payback period to more appropriate measures, such as return on investment, internal rate of return, and actual cost of ownership, as well as the many non-financial quality of life returns from zero energy homes.
Payback Period of Zero Energy Homes
Return on Investment for Zero Energy and Zero Energy Ready Homes
Return on investment (ROI) is another common calculation used to show returns on money invested in energy savings. If you applied ROI to a savings account, it would be the interest rate used to calculate the annual payment you get back from the bank. Right now, banks are paying less than 1% interest on savings accounts. Based on the RMI data, we calculated the 15-year return on investment on zero energy homes in five cities across the country, assuming electricity costs increase 2% each year. Using an ROI calculator, we entered the incremental cost to get to zero (the amount invested) and added the yearly energy savings over 15 years (amount returned), which included 2% energy inflation each year after the first year. The results were consistent across the six cities studied: The ROI of zero energy and zero energy ready homes is significant – up to nearly 12.5% per year in the best case.
ROI of Zero Energy Homes (In Dollars)
| Atlanta | Baltimore | Chicago | Houston | New York | San Francisco | |
| Initial Investment | 19,548 | 15,828 | 19,702 | 14,713 | 19,534 | 17,953 |
| Energy Savings 1st Year | 1,833 | 2,000 | 2,059 | 1,365 | 2,270 | 2,608 |
| Energy Savings for 15 Years | 31,698 | 34,586 | 35,607 | 23,605 | 39,256 | 45,101 |
| Net Return after 15 Years | 12,151 | 18,759 | 15,904 | 8,892 | 19,722 | 27,148 |
| Annualized ROI | 3.28% | 5.35% | 4.02% | 3.2% | 4.75% | 6.33% |
ROI of Zero Energy READY Homes (In Dollars)
| Atlanta | Baltimore | Chicago | Houston | New York | San Francisco | |
| Initial Investment | 6,094 | 2,738 | 1,945 | 1,290 | 4,166 | 2,694 |
| Energy Savings 1st Year | 794 | 749 | 746 | 431 | 850 | 909 |
| Energy Savings for 15 Years | 13,731 | 12,953 | 12,901 | 7,453 | 14,699 | 15,720 |
| Net Return after 15 Years | 7,636 | 10,215 | 10,956 | 6,163 | 10,533 | 13,026 |
| Annualized ROI | 5.56% | 10.92% | 13.44 | 12.40% | 8.77% | 12.48% |
Internal Rate of Return
Internal Rate of Return (IRR) is the way businesses determine the profitability of an investment over time. IRR is also the most accurate way of deciding if an investment is a good one. The basic idea is simple. If you invest $100 today, how much money will come back to you each year? This method of calculation takes into account that the investment in a zero energy building earns a monetary return each year through its energy savings. It’s similar to when a business borrows money to build a new factory or buy a new piece of equipment. It makes monthly loan payments, and as long as the monthly earnings from new business gained from that purchase are higher than the monthly costs, the investment is making a profit. In a similar way, borrowing money to make energy improvements is profitable if the monthly energy savings – equivalent to earnings in this case – exceed the loan payments.
To calculate IRR on zero energy homes, you’ll need to know how much cash comes in and goes out each year. The first year will certainly be a large negative number, because this is the year that you purchase the home energy improvements. Take Chicago, for example. The cost of energy upgrades in the RMI study was $19,702. But that number is not all expenses. This home will save $2,059 the first year. So the first year net cost ($19,702 – $2059) is really $17,643. The next year will have no expenses, and since energy costs rise each year, the savings will be even higher. We assumed a 2% electric cost escalation rate per year for projecting savings since the cost of electricity in the U.S. has gone up over 2% per year since 2000. So in the second year, the energy savings grow to $2,100. And the benefit keeps growing by 2% every year after that. Let’s see how this string of financial savings works out over a 15-year period.
Using an IRR calculator we entered the incremental costs to get to zero (initial investment) and the energy savings with 2% increments each year after the first for 15 years (cash flow). Again, our calculations show a consistent positive gain – or profit – across the board in the six cities we studied.
IRR on Investment in Zero Energy Homes (In Dollars)
| Atlanta | Baltimore | Chicago | Houston | New York | San Francisco | |
| Initial Investment | 19,548 | 15,828 | 19,702 | 14,713 | 19,534 | 17,953 |
| Energy Savings 1st Year | 1,833 | 2000 | 2,059 | 1,365 | 2,270 | 2,608 |
| IRR | 6.4% | 11.15% | 8.04% | 6.24% | 9.74% | 13.66% |
IRR on Investment in Zero Energy READY Homes (In Dollars)
| Atlanta | Baltimore | Chicago | Houston | New York | San Francisco | |
| Initial Investment | 6,094 | 2,738 | 1,945 | 1,290 | 4,166 | 2,694 |
| Energy Savings 1st Year | 794 | 749 | 746 | 431 | 850 | 909 |
| IRR | 11.7% | 28.5% | 40.02% | 34.90% | 20.79% | 35.25% |
Turning an Expense into an Investment
Far from being a financial burden or an unwanted “expense”, these ROI and IRR calculations show that zero energy homes are a good investment. In fact, the 6% return on the worst-case cities of Atlanta and Houston is better than any investment that guarantees not to lose value. At the high end, more than 13% is much better than most risky stock investments. And the best part is that there is no risk – once the home is built, costs are low and the returns keep coming. Investing in a well planned zero energy or zero energy ready home simply can’t be beat.
Cost of Ownership
When the incremental costs to get to zero are included in the mortgage, the average energy savings each month are greater than the added monthly mortgage payment, with the result that from the very first month of ownership, zero energy homes cost less to own. Indeed when we built zero energy homes in Bend in 2011 and 2015, we found that they have a lower cost of ownership than similar homes built to code.
In an Efficiency Vermont study, zero energy and zero energy ready homes were found to “cost less to own and operate than (similar) code buildings from the first year into the long term.” The long term gets even better as electric rates increase at about 2% a year, increasing the stream of income that further lowers the cost of ownership every year.
Similarly, using RMI data, we find the cost of ownership is lower for zero energy and zero energy ready homes than it is for conventional homes throughout the country. We used a mortgage calculator to figure the monthly amount added to a mortgage to cover the incremental costs of getting to zero at the current national average interest rate of 4.54% for 30 years and assumed a 2% yearly increase of energy savings resulting from inflation, after the first year. We did not include the monthly hook-up fee charged by many, but not all, utilities (often around $5 to $12 per month) since they vary from utility to utility.
Cost of Ownership of Zero Energy Homes (In Dollars)
| Atlanta | Baltimore | Chicago | Houston | New York | San Francisco | |
| Initial Investment | 19,548 | 15,828 | 19,702 | 14,713 | 19,534 | 17,953 |
| Monthly Energy Savings | 152 | 167 | 171 | 113 | 189 | 217 |
| Monthly Increase in Mortgage Payment | 100 | 81 | 100 | 75 | 99 | 91 |
| Monthly Earnings from ZE Improvements | 52 | 86 | 71 | 38 | 90 | 126 |
In each case outlined in the table above, earnings exceed costs, starting the very first month. Once again, that’s called a profit.
Cost of Ownership of Zero Energy READY Homes (In Dollars)
| Atlanta | Baltimore | Chicago | Houston | New York | San Francisco | |
| Initial Investment | 6,094 | 2,738 | 1945 | 1,290 | 4,166 | 2,694 |
| Monthly Energy Savings | 66 | 62 | 62 | 37 | 70 | 76 |
| Monthly Increase in Mortgage Payment | 31 | 14 | 10 | 7 | 21 | 14 |
| Monthly Earnings from ZE Improvements | 35 | 48 | 52 | 30 | 49 | 62 |
Don’t forget the “E”
Lenders usually use PITI (principal, interest, taxes, and insurance) for evaluating a home’s cost of ownership, but this standard formula does not include energy costs – an important part of the cost of homeownership. If lenders used PITI+E, with the E standing for energy costs, it would more accurately reflect the true cost of ownership and show that zero energy homes are almost always the winners. Builders, designers, realtors, and policy makers should give first place to cost of ownership calculations when advocating for zero energy homes. The true cost of ownership, including energy costs, clearly shows that homeowners benefit financially from zero homes from the very first month. In addition, PITI+E clearly demonstrates that zero homes are preferable for lower income homeowners as well.
Instead of referring to the added costs of building a zero energy home, all stakeholders should mention the profitability of investing in a zero energy home. As we will show in Part Two, not only do zero homeowners win financially, they and their families profit in a wide variety of other ways, as do almost all stakeholders.
* “In all climates, the cost optimal solution from RMI’s analysis included 100-percent LED lighting, low-flow water fixtures, and ENERGY STAR appliances, all of which reduce load at a very minimal cost premium. In addition, heat pumps were used for both space heating and water heating. The roof, walls, and windows were efficient but did not exceed the Department of Energy’s Zero Energy Ready Home (ZERH) prescriptive efficiency levels. Each baseline model was the same 2,200-square-foot, three-bedroom, two-bathroom home with a two-car garage but envelope and HVAC properties were climate zone-specific to the levels required by IECC 2009 energy code.” The incremental cost for getting to zero did not include any state or local incentives, but did include the 30% federal tax credit for solar.
Joe Emerson is founder of the Zero Energy Project. Bruce Sullivan is the technical consultant for the Zero Energy Project. Special thanks to David Green author of GreenZeroCarbonHome.com and to the the authors of the RMI study on the Economics of Zero Energy Homes.

Skip Bennett says:
Hello, I have a 1800 SF house in Maryland. I just finished installing 8″ nail base on my roof, spraying closed cell foam 4″ thick on the outside of my walls all the way down to my footings and installing all new energy efficient doors and windows. I also installed an ERV.
I need help calculating the homes efficiency so the local government will accept my insulation as sufficient for their code.
Please advise an individual or company that can review and advise.
Thank you in advance.
Regards,
Skip Bennett
410-991-5743
service@skipbennettmarine.com
Bruce Sullivan says:
Hey Skip,
You need an “energy rater”. Luckily there is a whole industry of these certified professionals. A nationwide listing is available here:
https://www.hersindex.com/find-a-hers-rater/
Polestar says:
Thank you for posting such relevant content! I am very glad to see that these days people become more and more concerned about the environment. After all, the situation demands it.
Portella says:
Thank you for sharing! Given the worsening environmental conditions, we should strive to make our homes more eco-friendly.