One of the many great things to come out of my work with Dan Kolbert in Portland, Maine, is our mutual desire to monitor the hygrothermal performance of what we are building. After some lengthy research, we settled on burying Omnisense monitors in our assemblies to collect data. It’s a practice I’ve written about here before and have discussed on this BS* + Beer Show episode.
We have a few years’ worth of data under our belts at this point, so I want to throw some of it out there for discussion. What follows is a surface-level look at what’s happening inside some of the double-stud walls Dan and I built together in Maine.
Many of you may be aware of what Dan refers to as “the yeti of building science.” I can’t recall if he coined that phrase but it’s a good one. This “yeti” is the idea that double-stud walls are going to have dangerous levels of moisture accumulation throughout the winter months that will result in anything from mold growth to catastrophic rot and failure. The joke here is that it’s a yeti because it’s often talked about but rarely, if ever, seen.
So, let’s dive into it.
The data in the graph represent three years — the spring shoulder seasons — inside a double-stud wall. This is a 12-in.-thick cellulose wall on a well-shaded north side. It has a vented rainscreen and corrugated metal cladding. The house tested 0.61 air changes per hour at 50 Pascals (ACH50) and is served by a somewhat underperforming Panasonic ERV (but that’s another story).
The graph shows wood moisture equivalency (WME) measured in the stud adjacent to the sheathing surface. As one would expect, the wall begins its life with a higher peak, which accounts for the moisture contained in the assembly at the end of construction — from wet lumber, drywall, paint, floor finishes, etc. Over time, we see the familiar peaks and valleys as the wall takes on moisture during the winter season and releases it as temperatures warm in the spring. What’s interesting to me is a trend we are seeing: those peaks are lower and lower each subsequent year as the assembly approaches some sort of equilibrium.
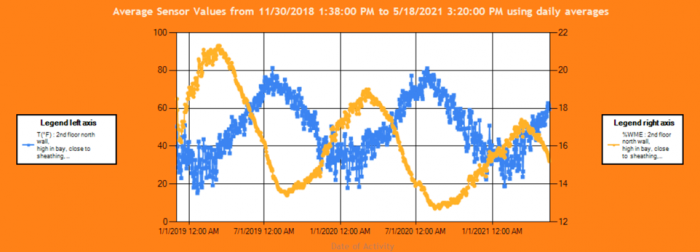
Temperature (blue) and wood moisture equivalency (WME) from 2019 to 2021.
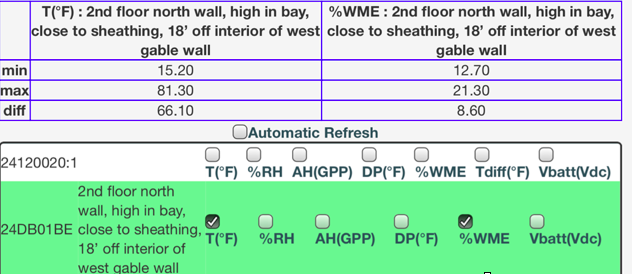
Measurement parameters and results.
So, where’s the risk? Mold and biological growth needs a steady 20%+ WME and a temperature above 50℉. (I’m not a mold expert but these are widely accepted baselines.) The hawk-eyed among you will see that in the first year of this wall’s life it had a peak of 21.3%WME. Here’s the rub . . . at the time of that peak, we we’re just coming out of the valley for temperature. Any time the wall was above 20%WME, it was well below 50℉. The temperature starts to climb as the moisture levels are dropping. This indicates to me that those predictions of failure are unlikely to manifest — much like the mythical yeti creature.
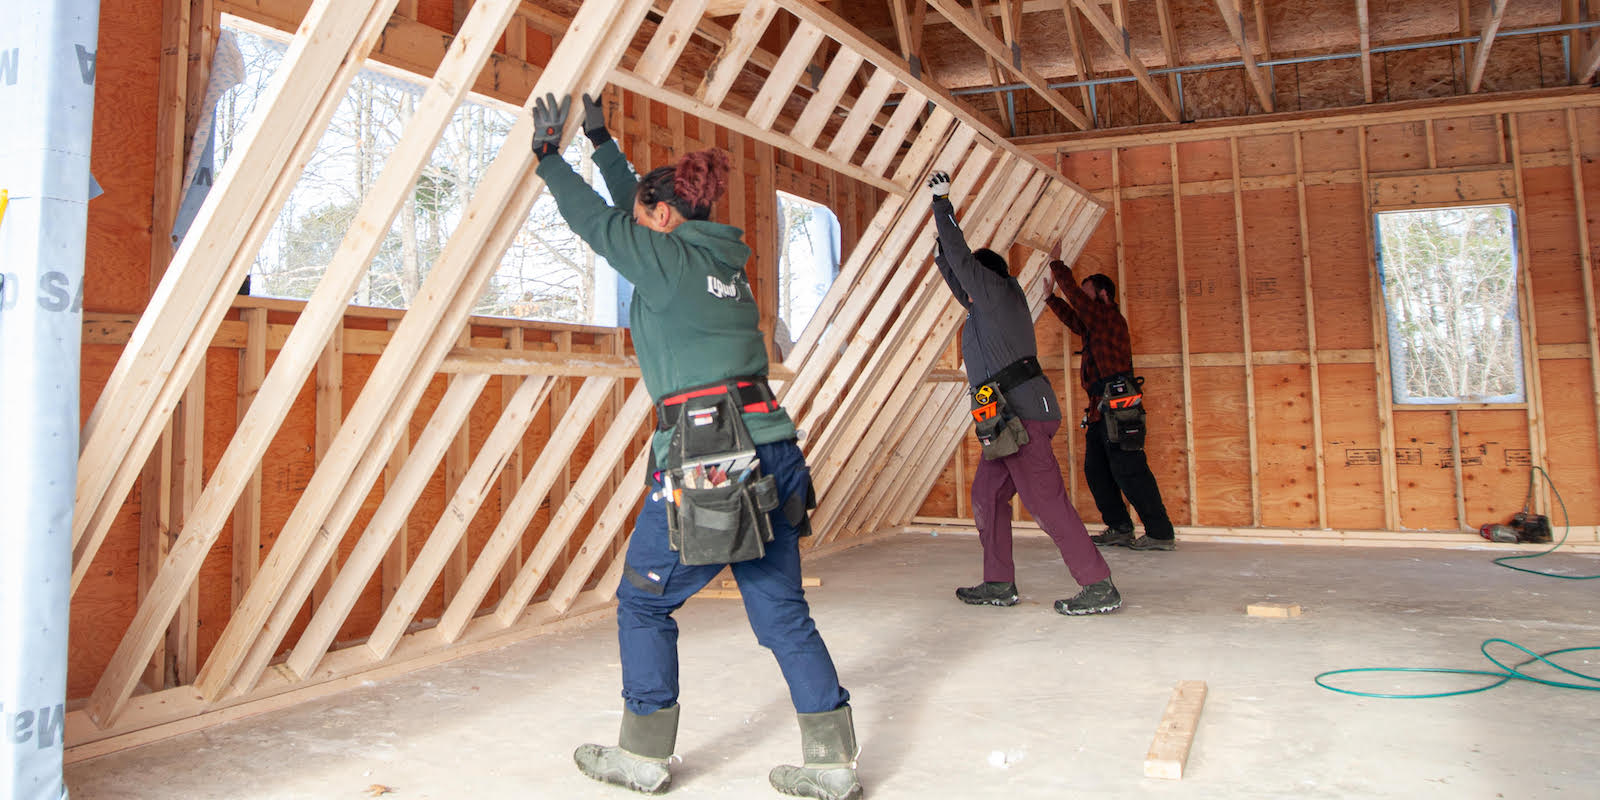
Ben Bogie is a second-generation, high-performance-building obsessive working as a project manager for BPC Green Builders of Wilton, CT. Photo by Scott Gibson. Graph courtesy of author. This post first appeared in Green Building Advisor.
